How to Use the Retirement Calculator
A comprehensive guide to using our retirement calculator to plan your financial future with confidence.
Getting Started
Our retirement calculator helps you understand how your retirement savings might last through your golden years. Adjust your inputs to see how inflation, investment returns, Social Security, and income needs affect your plan and withdrawal rates.
Step 1: Enter Your Financial Information
Use the inputs in the "Your Financials" and "Economic Assumptions" cards at the top of the page. For convenience, the three "Your Financials" inputs are also duplicated directly above the chart and table so you can tweak values while viewing results.
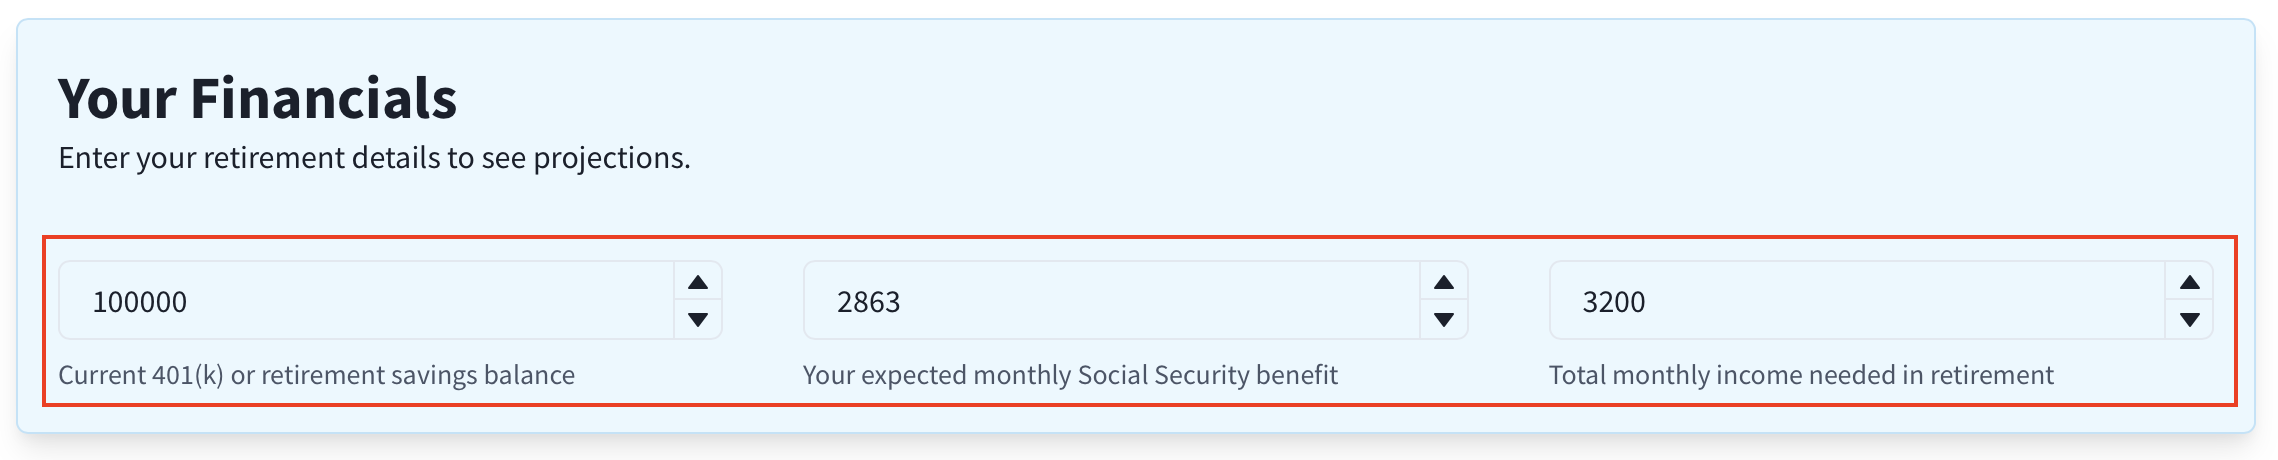
Starting Balance:
Your current retirement savings across accounts.Social Security (monthly):
Your expected monthly benefit.Total Monthly Income:
Your target monthly income in retirement (before tax).
In "Economic Assumptions":
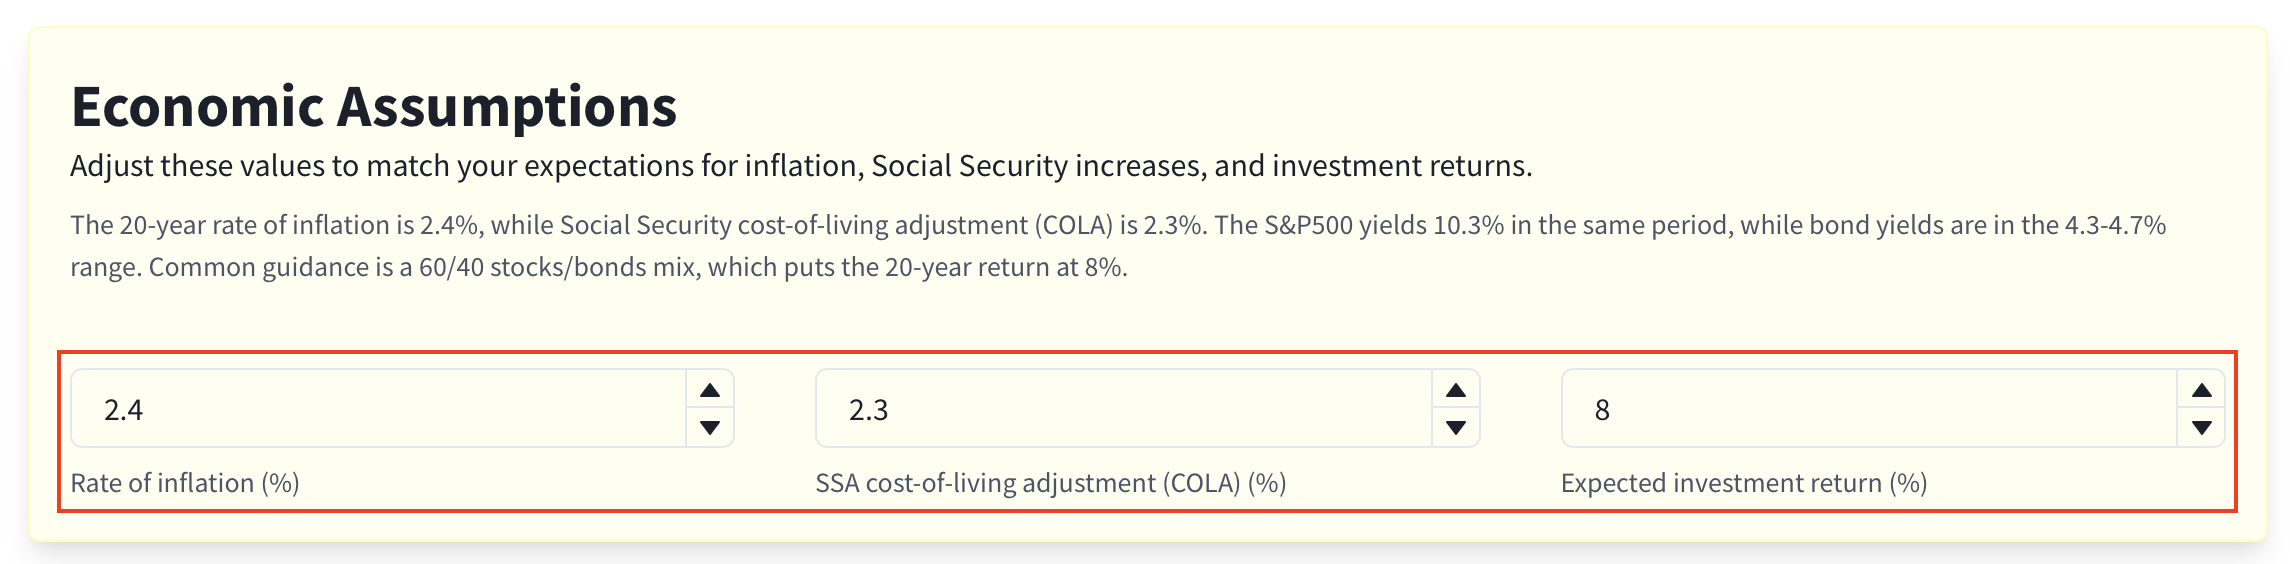
Inflation:
Used to adjust your income goal and compute buying power (real dollars).COLA:
Annual Social Security cost-of-living adjustment.Investment Return:
Annual return applied to your balance.
Step 2: Review the Income Preview
The Income Preview highlights key years in your retirement plan and summarizes the monthly goal, Social Security income, and the 401(k) withdrawal required to meet that goal. It also flags when your withdrawal rate exceeds the commonly-cited 4% guideline.
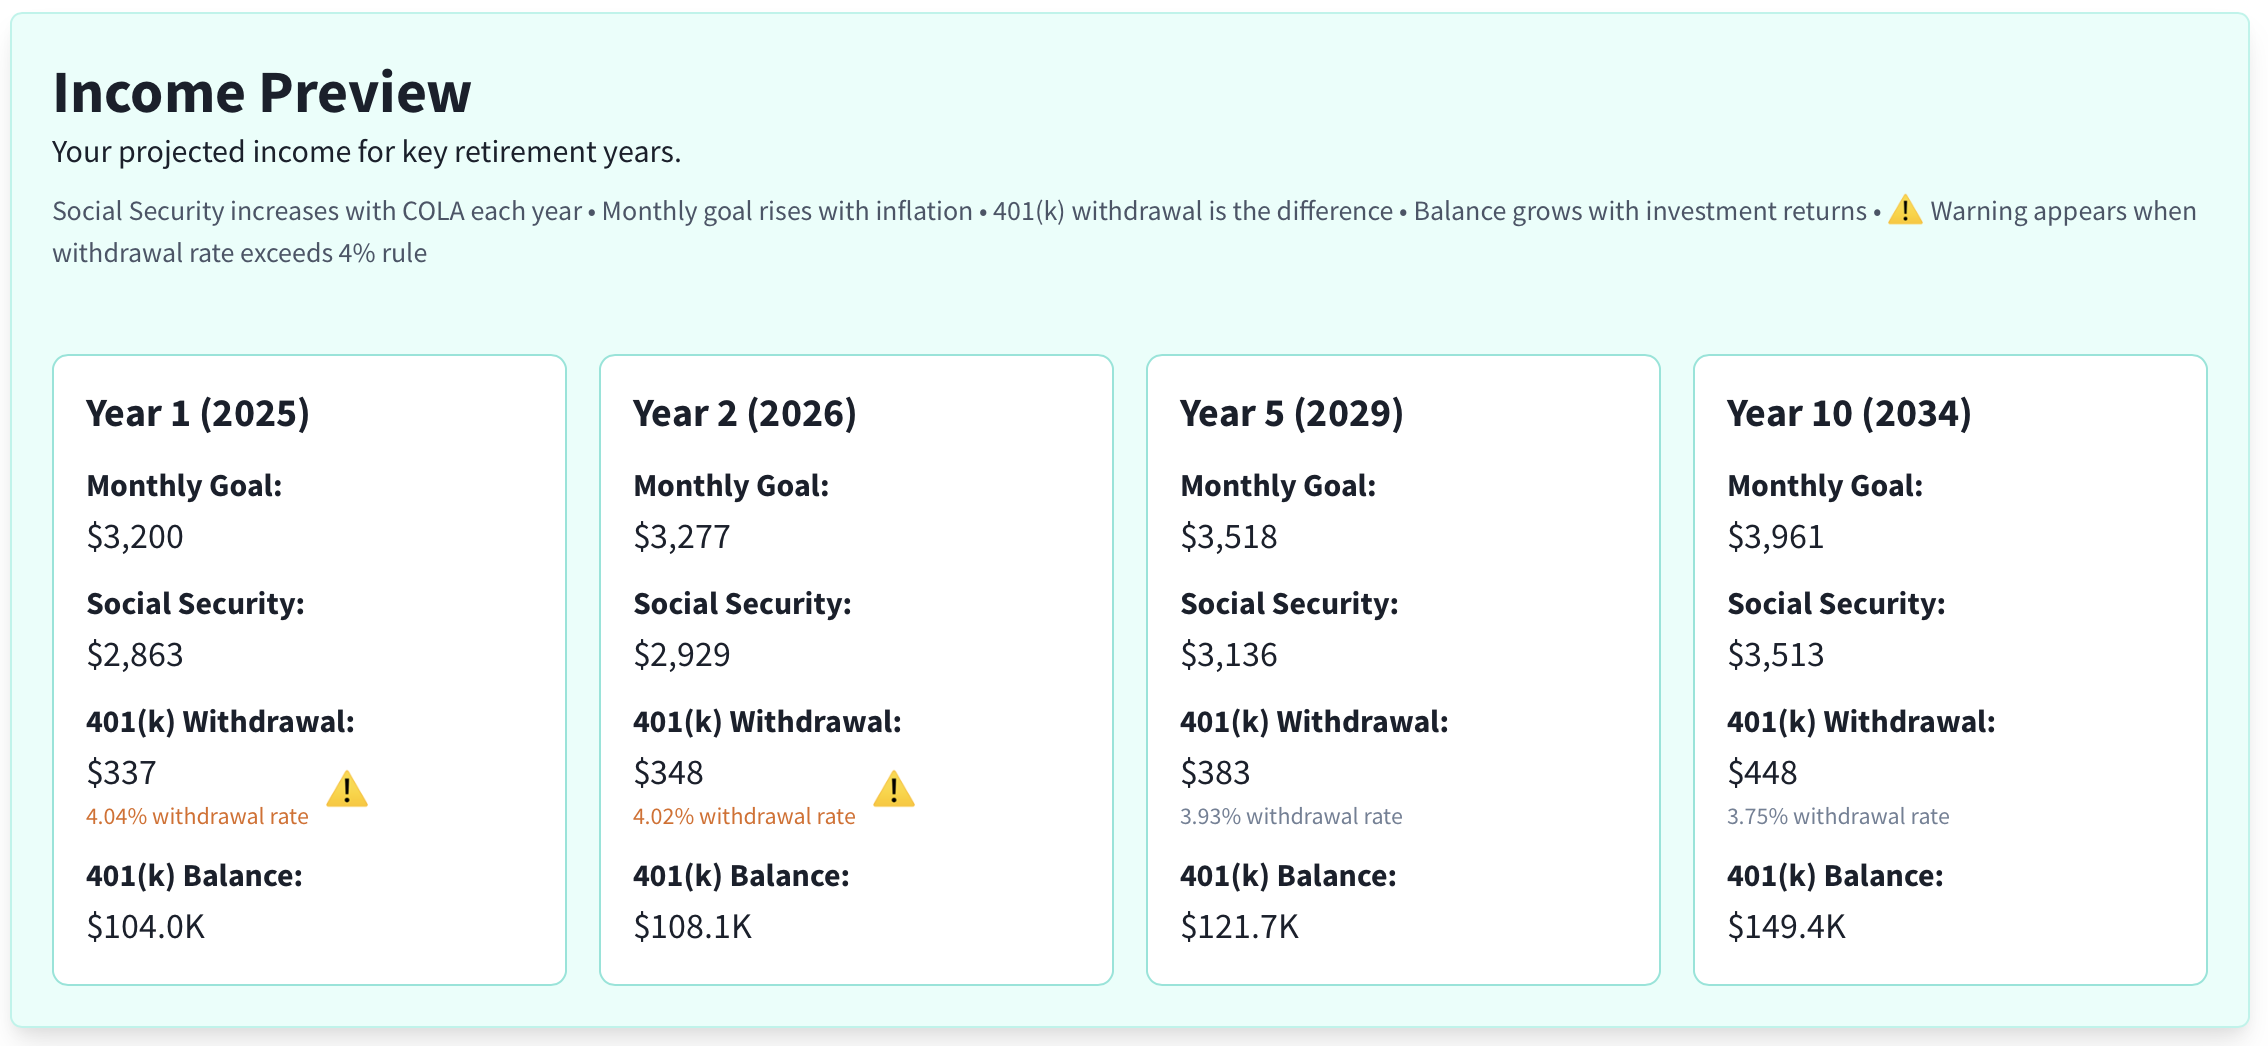
Use this section to quickly gauge whether your plan appears sustainable in the near- and medium‑term and whether you may need to adjust your monthly income goal, Social Security assumption, or expected returns.
Here, the withdrawal rate starts slightly above 4% ⚠️ in years 1–2. With the current inflation, COLA, and return inputs, it declines and remains under 4% in subsequent years.
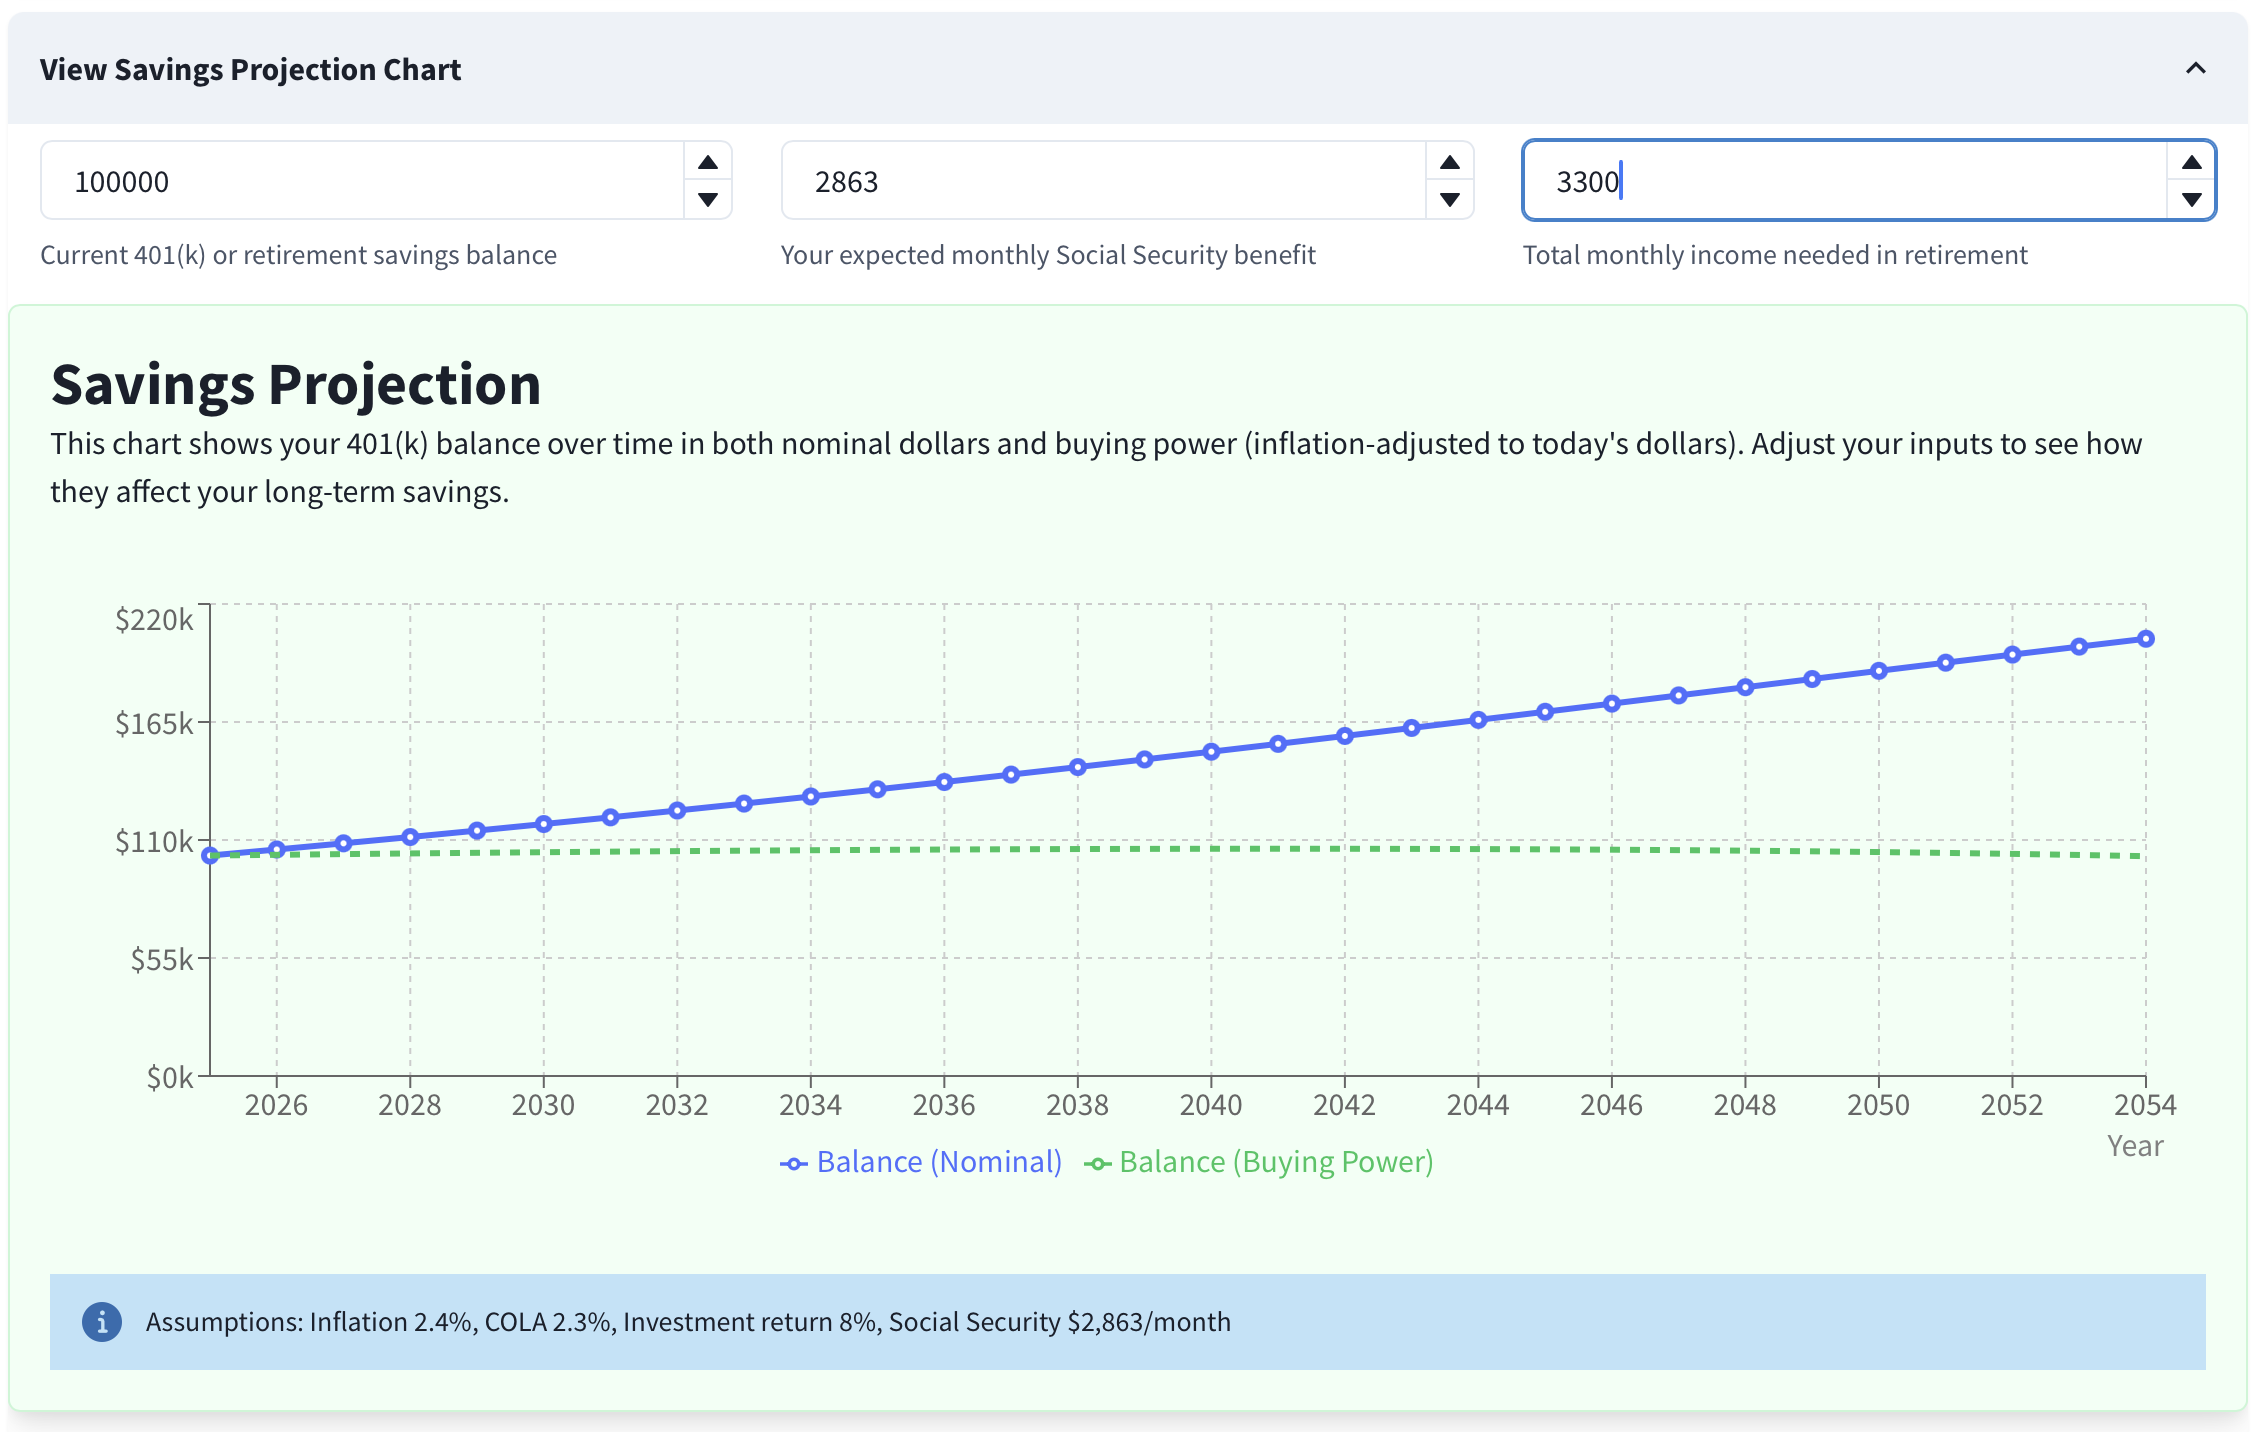
Step 3: Understand the Balance Projection Chart
The Balance Projection chart shows how your retirement savings may change over time. It includes two lines:
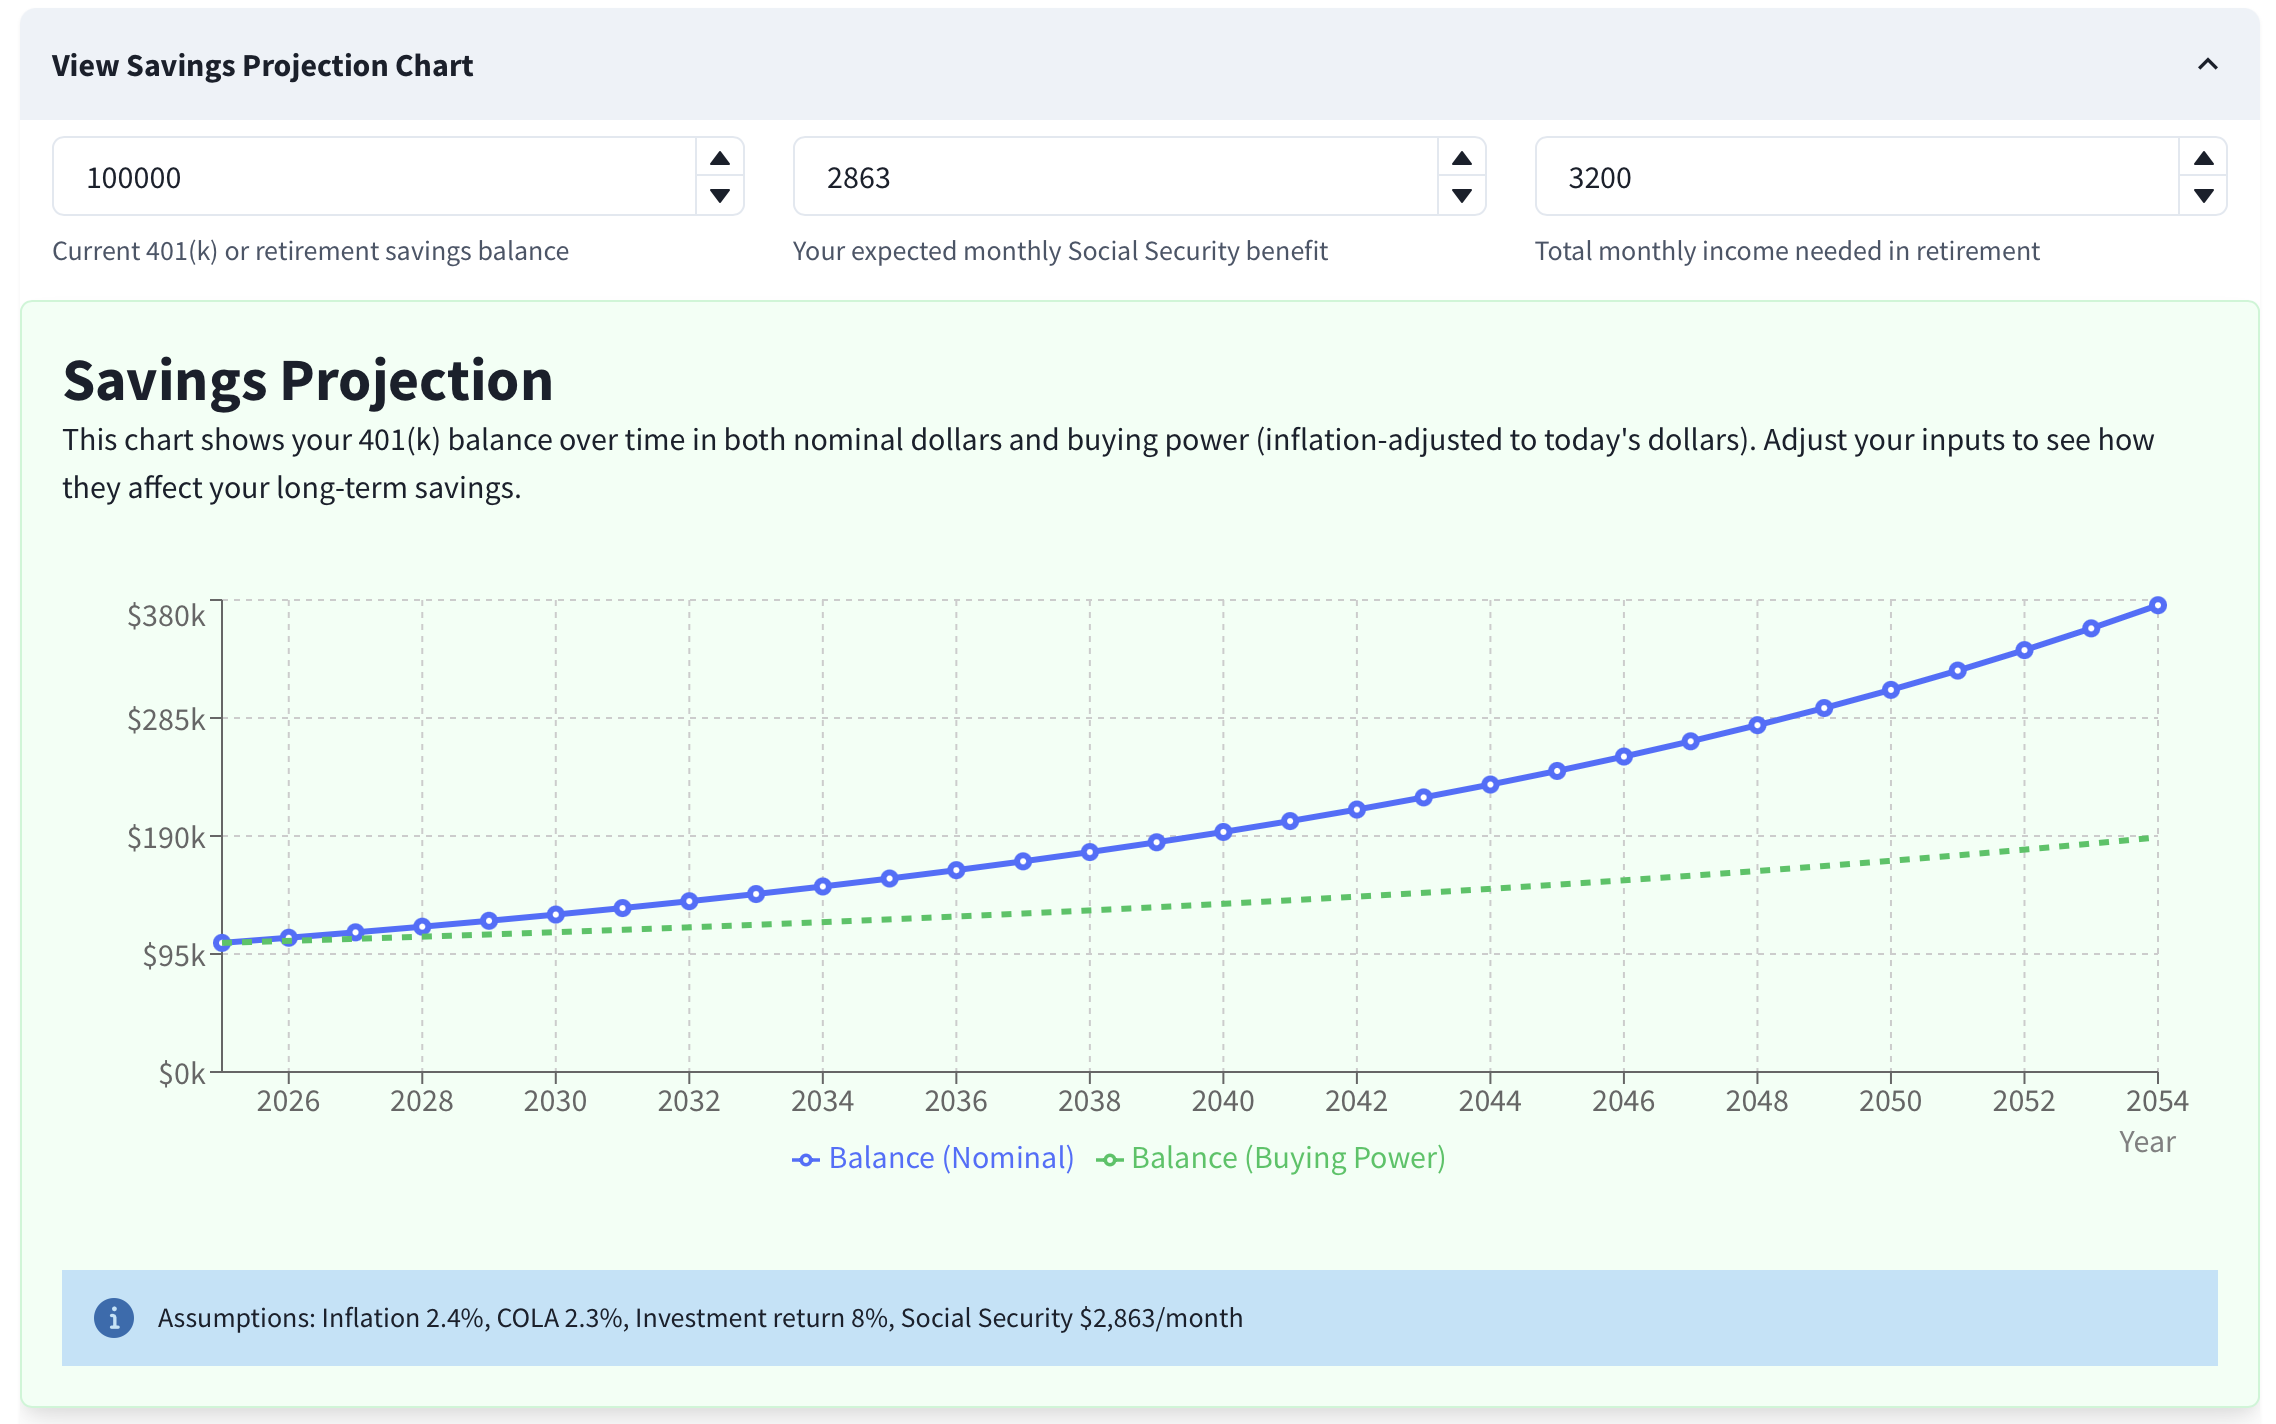
Balance (Nominal):
Your raw account balance without adjusting for inflation.Balance (Buying Power):
Your balance adjusted for inflation to reflect today's dollars.
When a line reaches zero, your savings would be depleted at that point in time. Update inputs above the chart to see immediate changes.
Step 4: Review the Detailed 30-Year Projection Table
Below the chart, you'll find a detailed year-by-year breakdown of your retirement finances. This table shows:
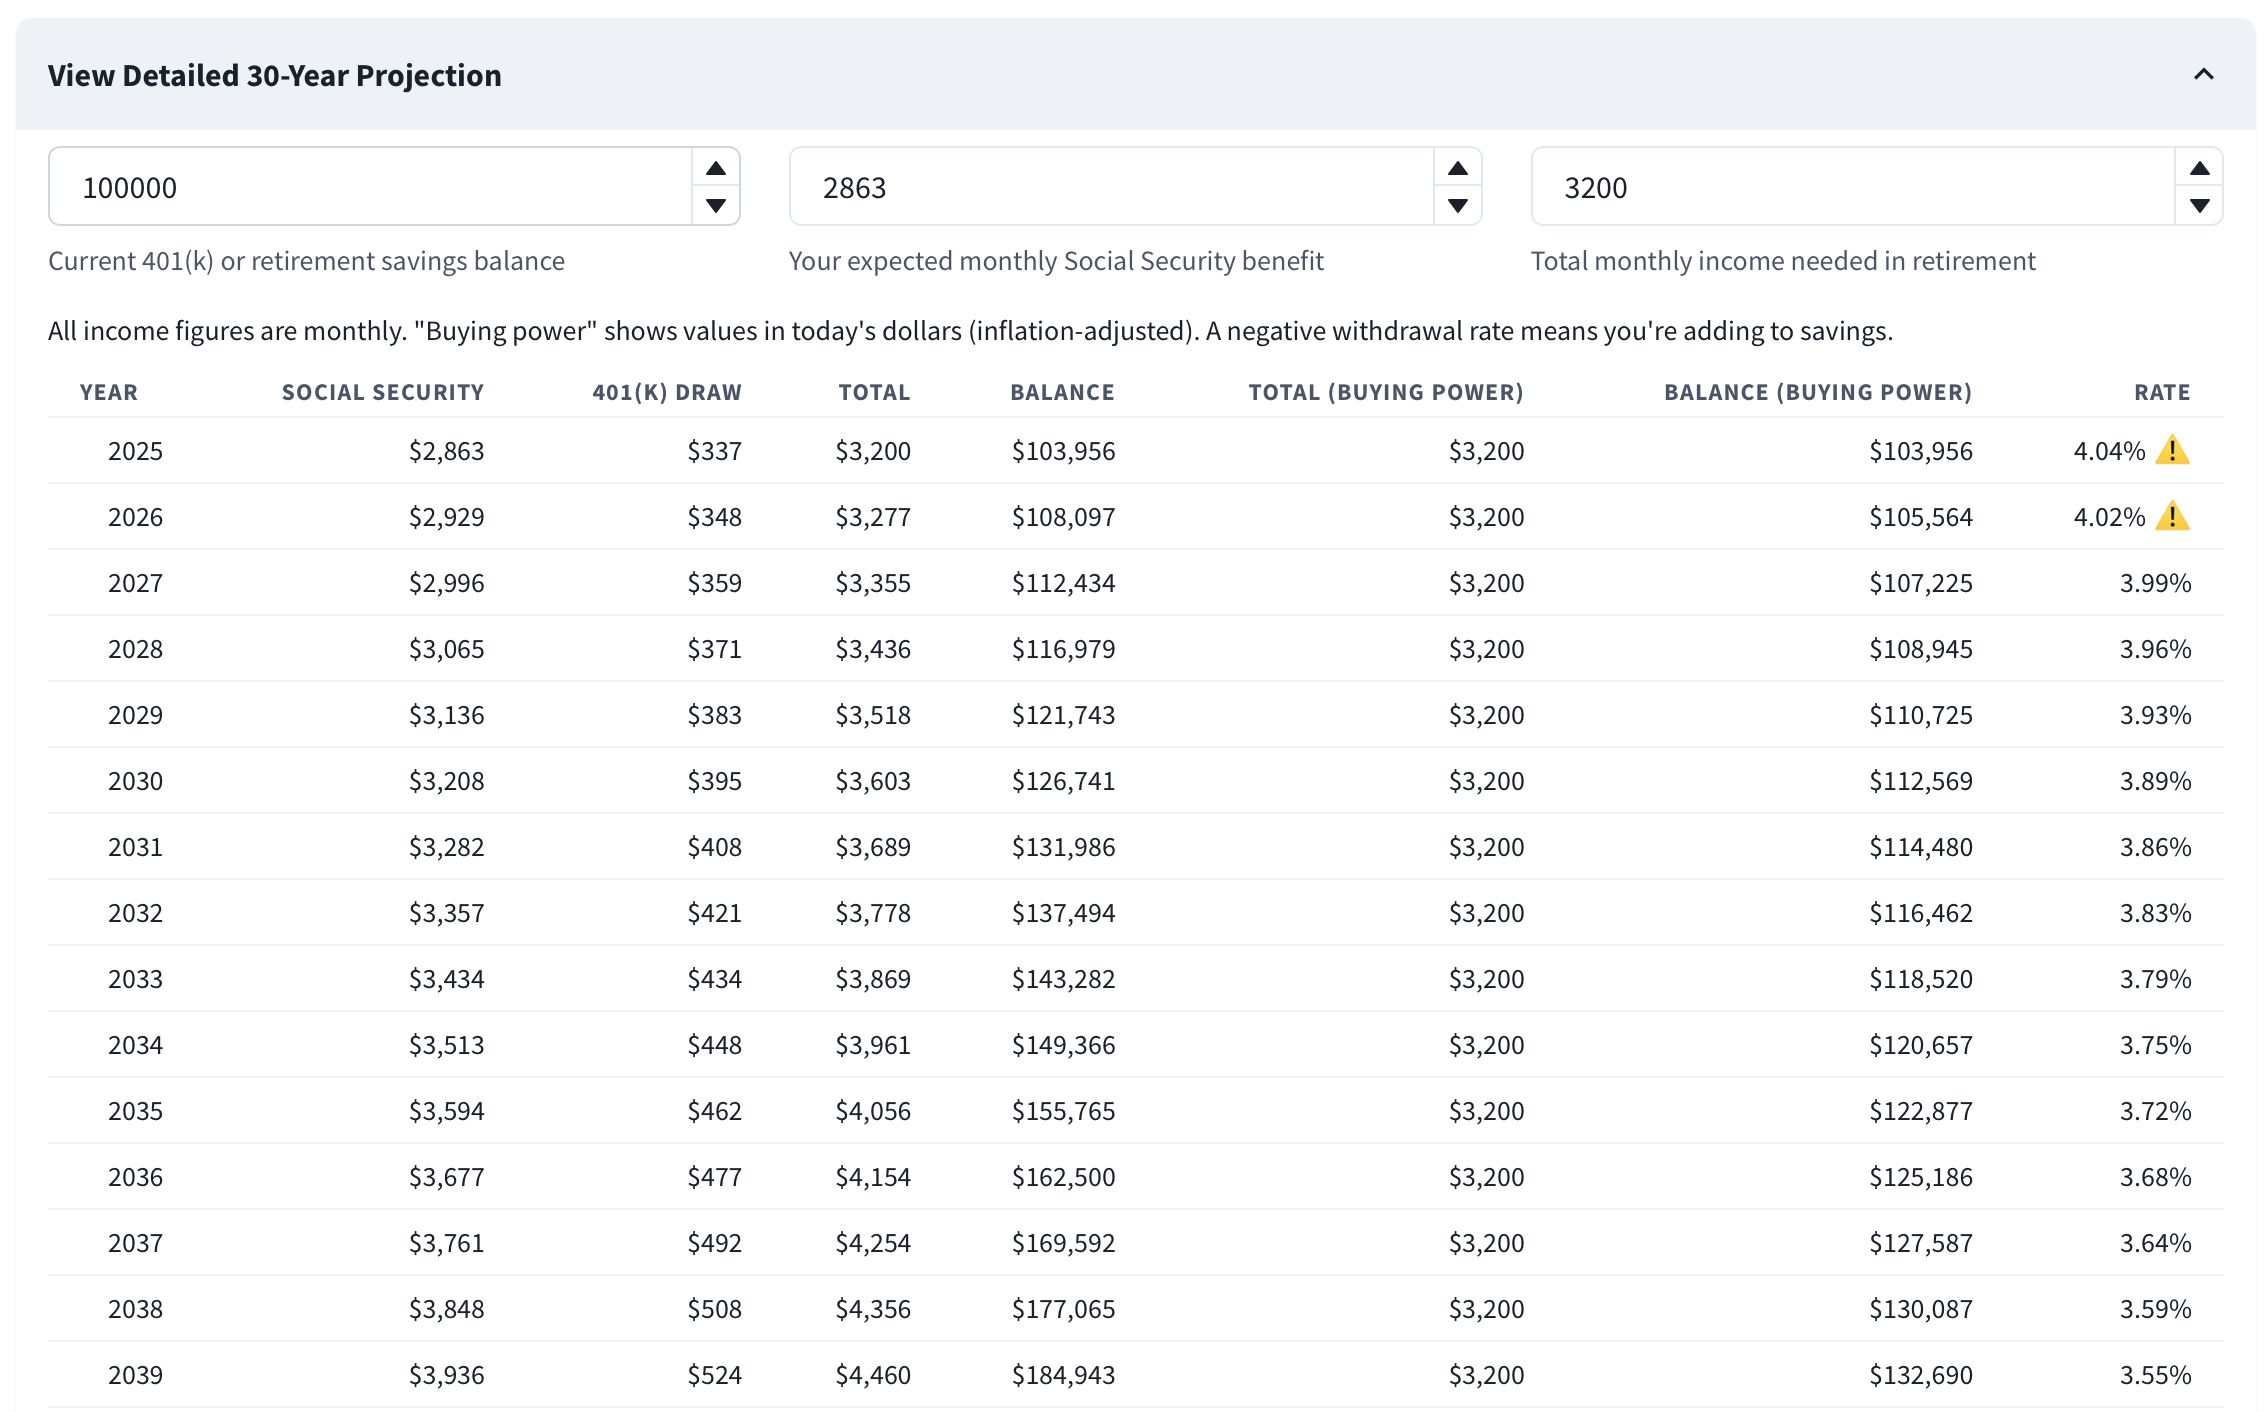
Social Security Monthly Income:
Your projected monthly benefit, increasing with cost-of-living adjustments.401(k) Monthly Withdrawal:
How much you'll need to withdraw from savings to meet your income goal.Total Monthly Income:
Combined income from Social Security and retirement savings.401(k) Balance:
Your remaining retirement savings at the end of each year.Withdrawal Rate:
The percentage of your savings you're withdrawing annually. The "4% rule" suggests keeping this under 4% for sustainability.Buying Power Columns:
Total monthly income and ending balance expressed in today's dollars (inflation-adjusted) so you can compare real value over time.
Step 5: Interpreting the Results
The best sustainability signal is the Balance (Buying Power) line in the chart. Because inflation erodes purchasing power, the nominal Balance line can rise even while your real (inflation‑adjusted) spending power is flat or falling. Aim to keep the Buying Power line roughly level over time. A gently rising line suggests extra cushion; a gently declining line suggests you may need to spend a little less or improve assumptions.
How to interpret and adjust:
If Buying Power is level:
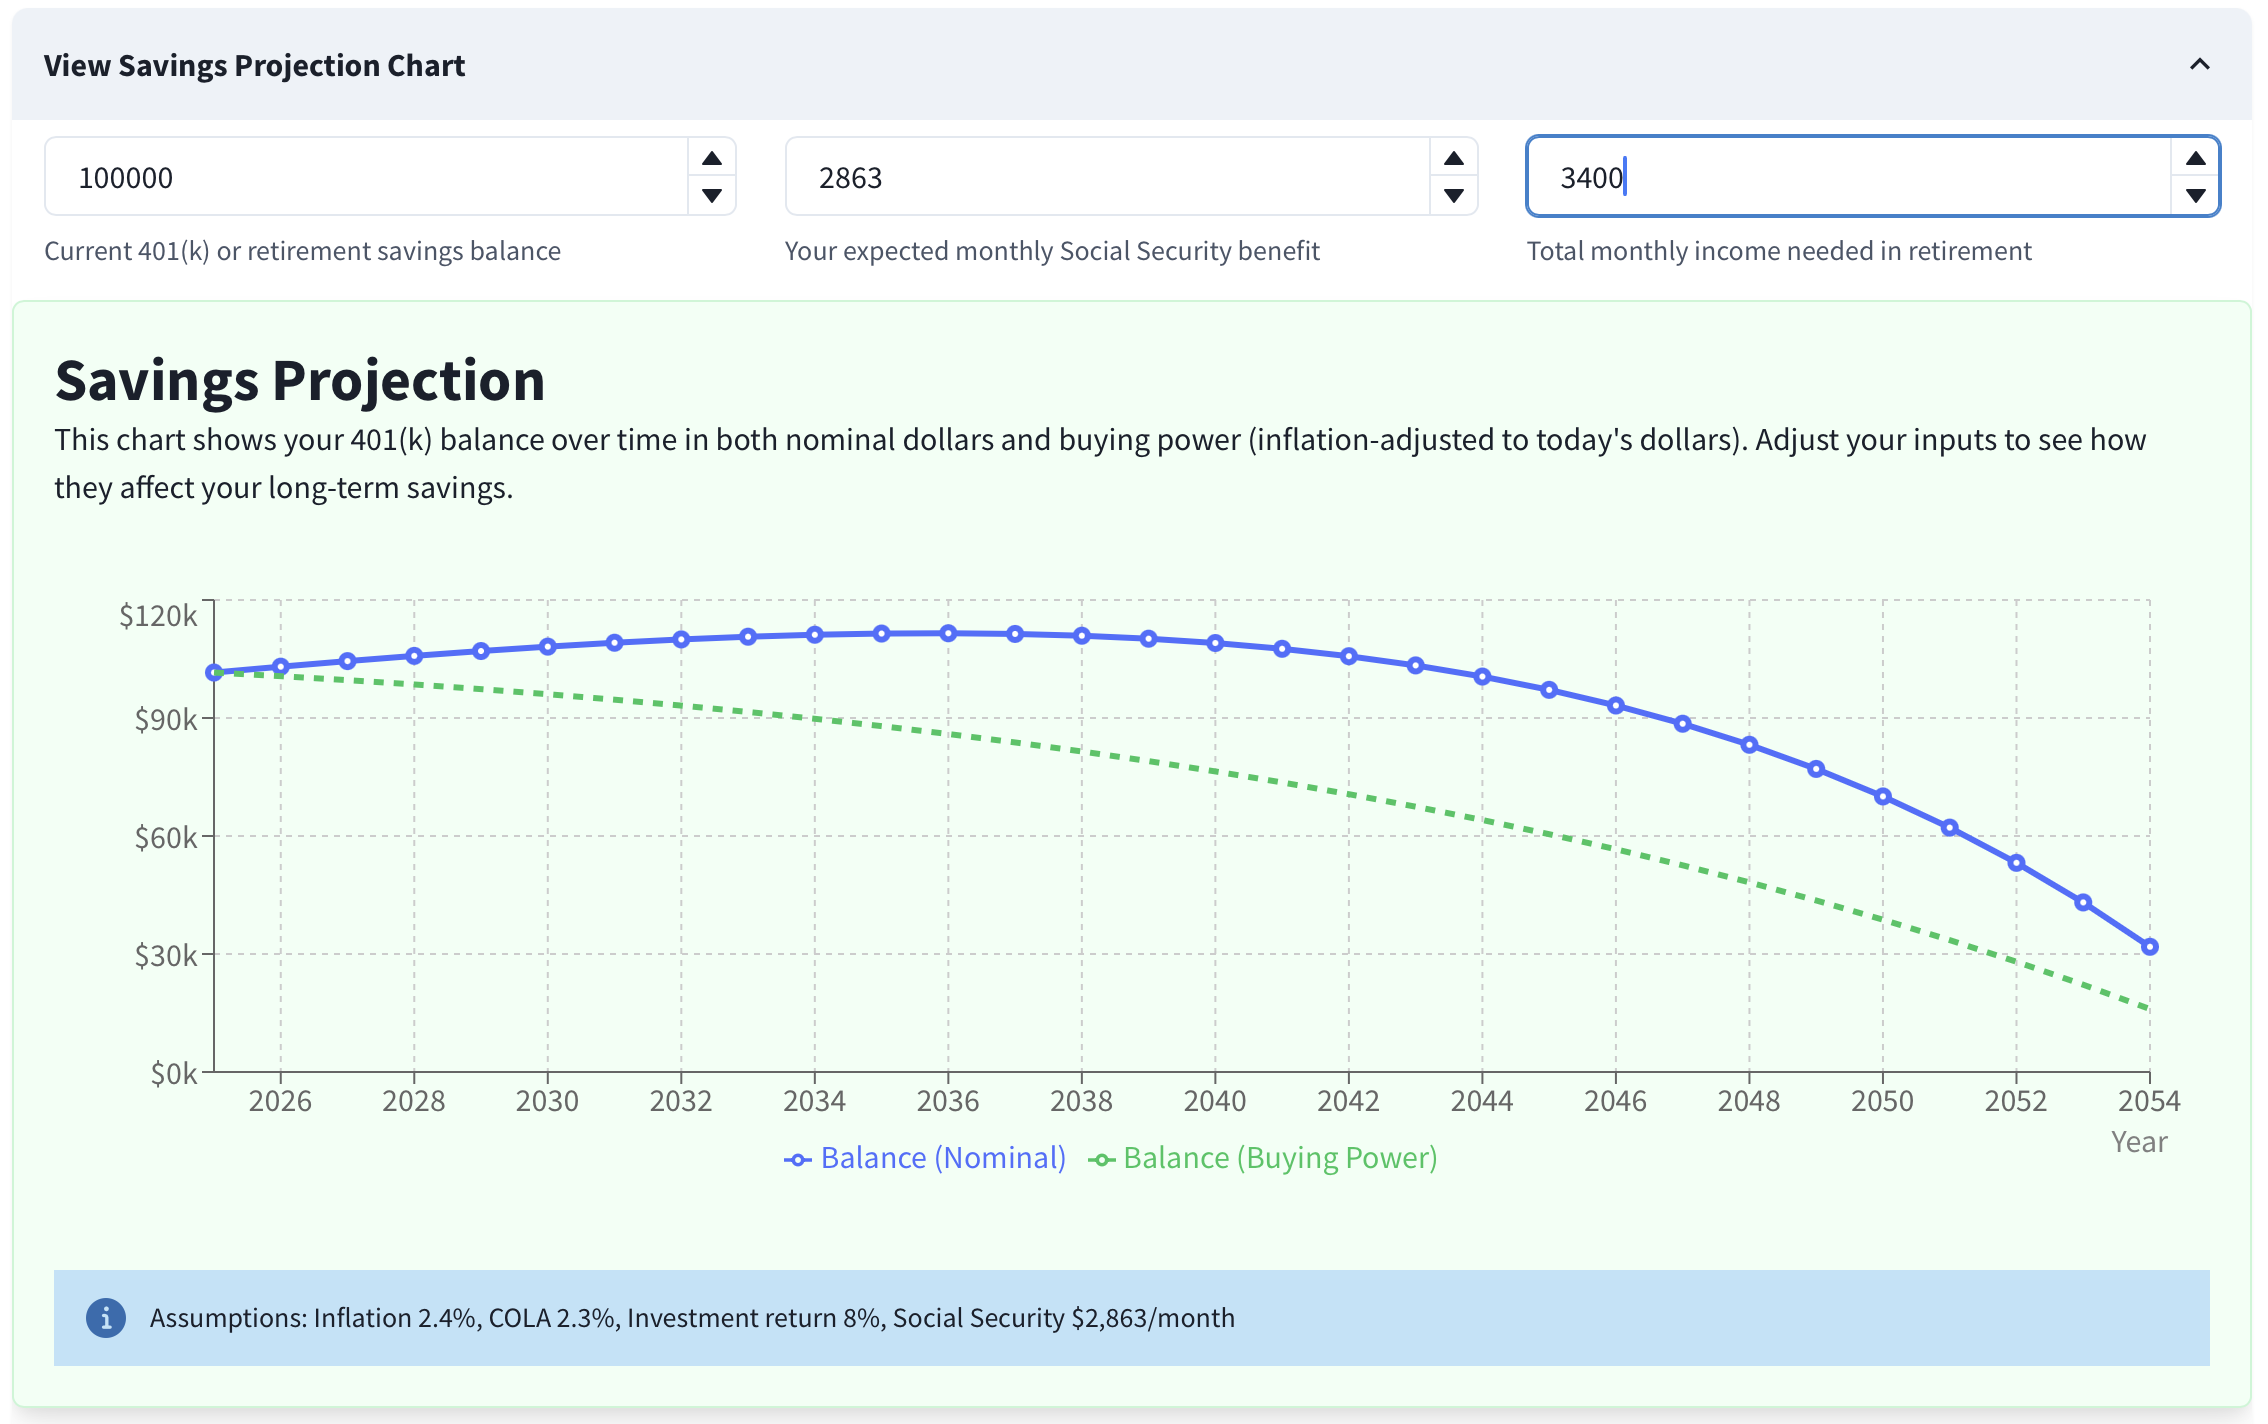
Your plan is roughly sustainable under current assumptions. Keep monitoring and revisit annually.If Buying Power declines:
Reduce the monthly income goal, delay retirement, increase savings, or use more conservative inflation/return assumptions.If you see withdrawal warnings or depletion:
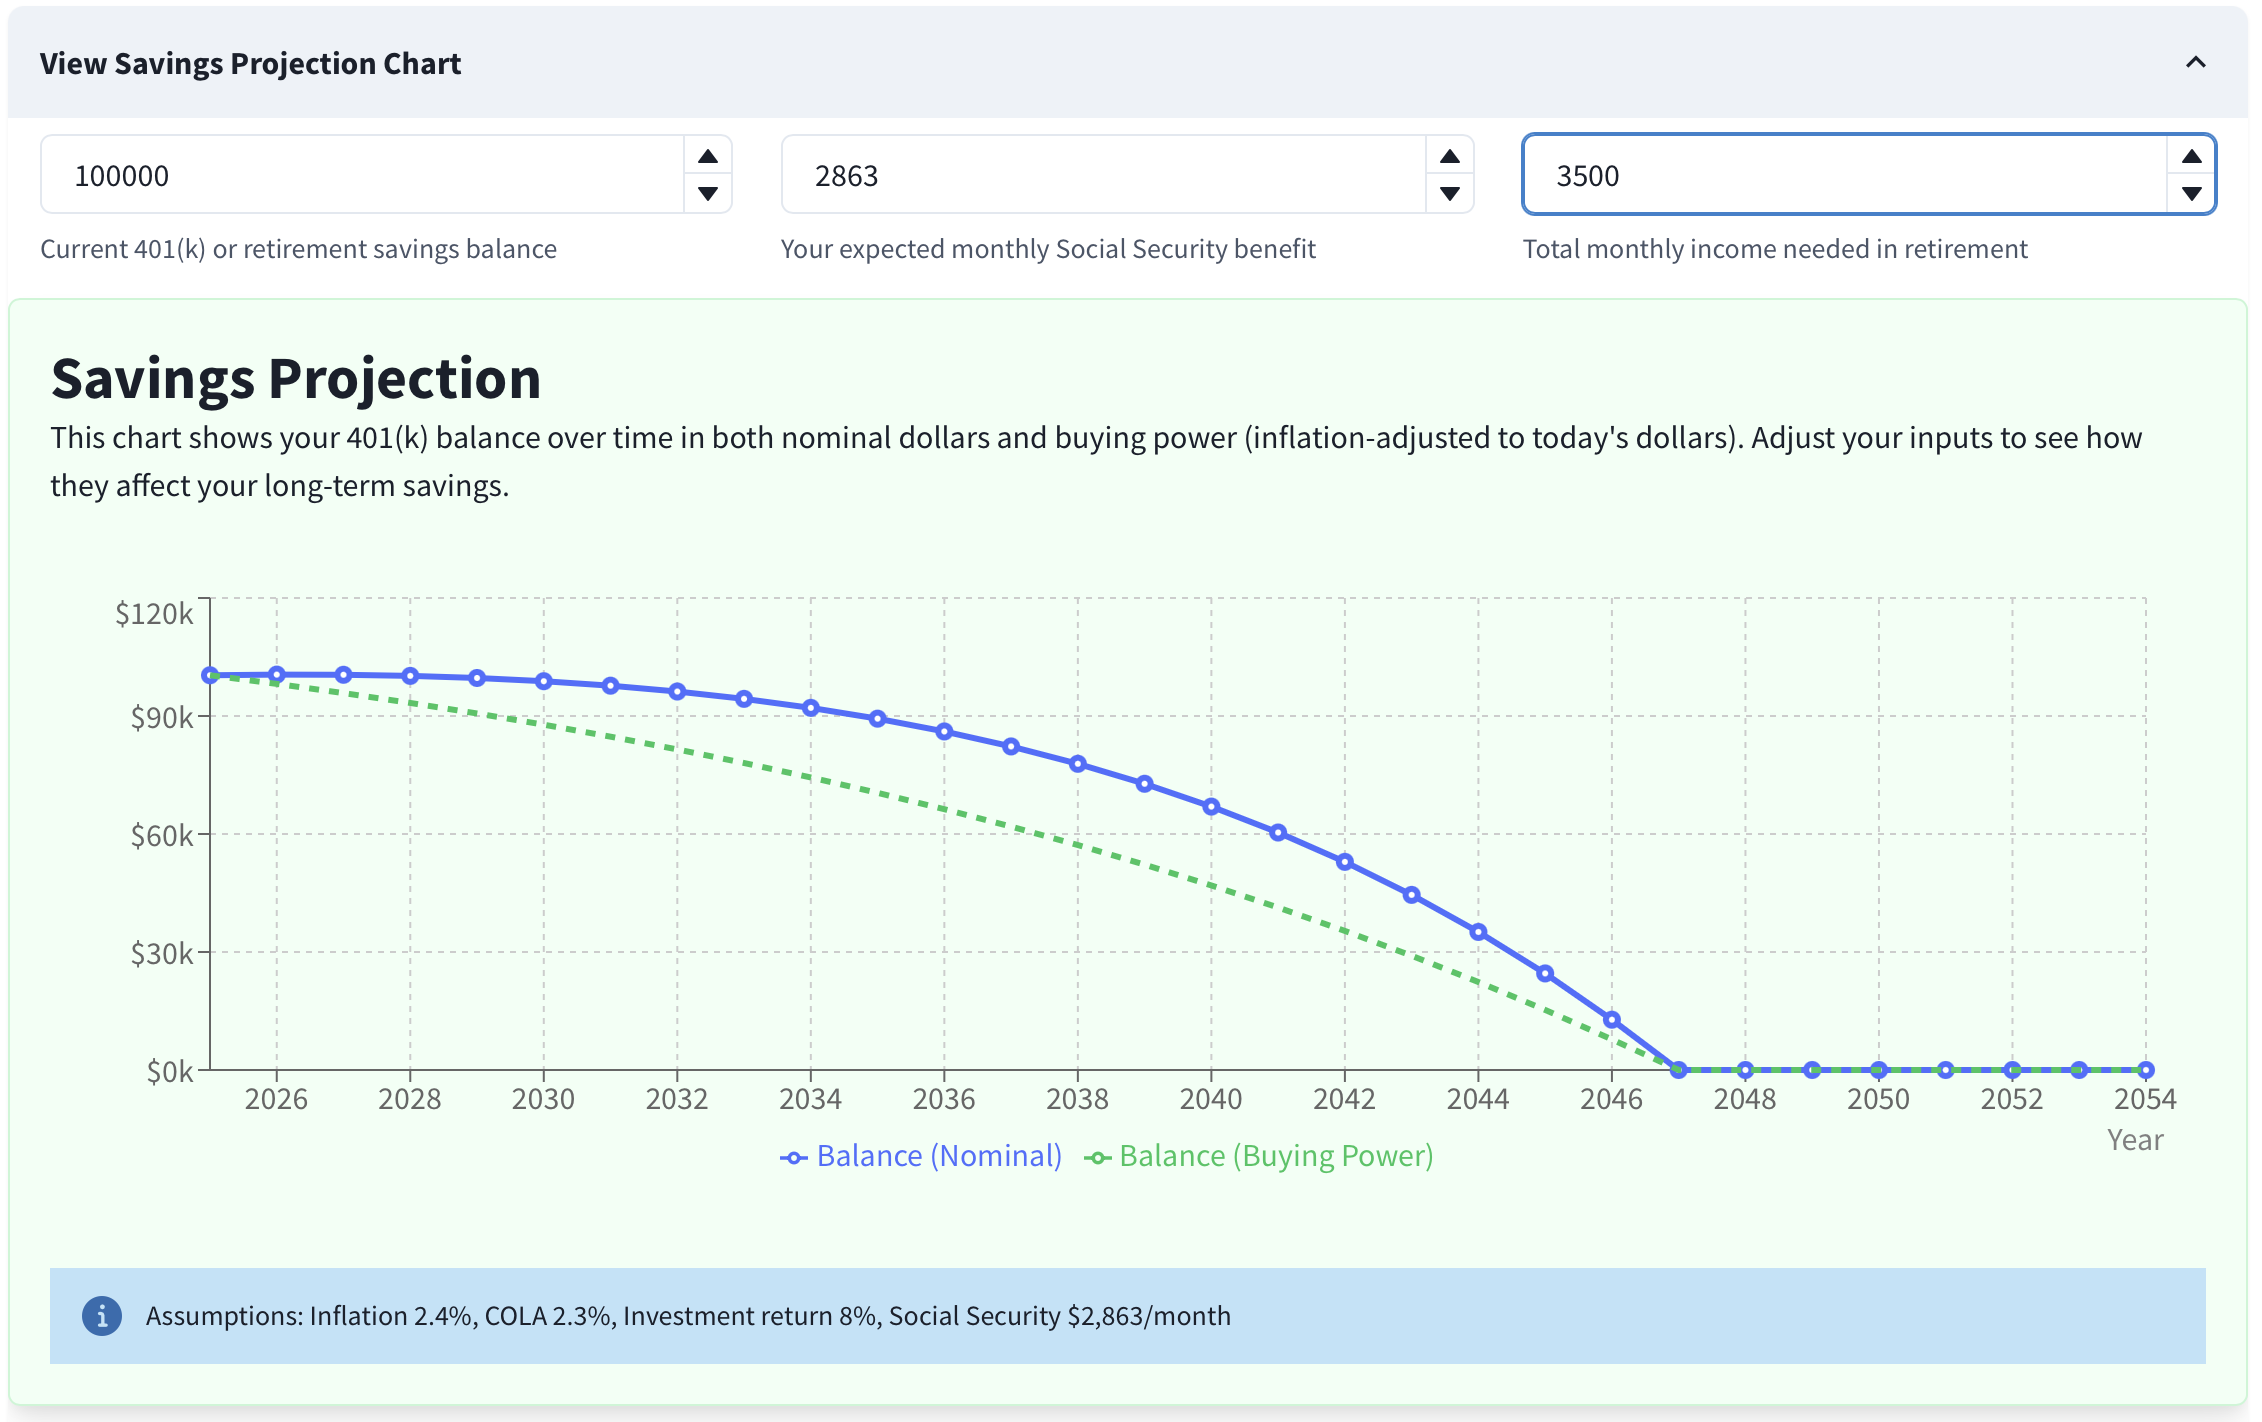
Your withdrawal rate exceeds the 4% guideline or your savings run out. Lower the income target, increase Social Security assumptions (if realistic), or assume lower returns and re‑plan.
Setting monthly income to $3,300 keeps the Buying Power line approximately level. This is a good signal that your plan is sustainable under current assumptions.
Increasing monthly income to $3,400 makes Buying Power trend downward — consider reducing spending or improving assumptions.
Withdrawing enough for a $3,500 monthly income leads to eventual depletion — warnings and the table will reflect this.
Levers to adjust when results aren’t acceptable:
Monthly income goal:
Try small adjustments (±$100–$200) and observe the Buying Power trend.Social Security:
Update your expected benefit and COLA to match your statement/assumptions.Investment return:
Use more conservative returns if your portfolio will be safer in retirement.Start date/savings:
Delay retirement or increase savings contributions to improve longevity.
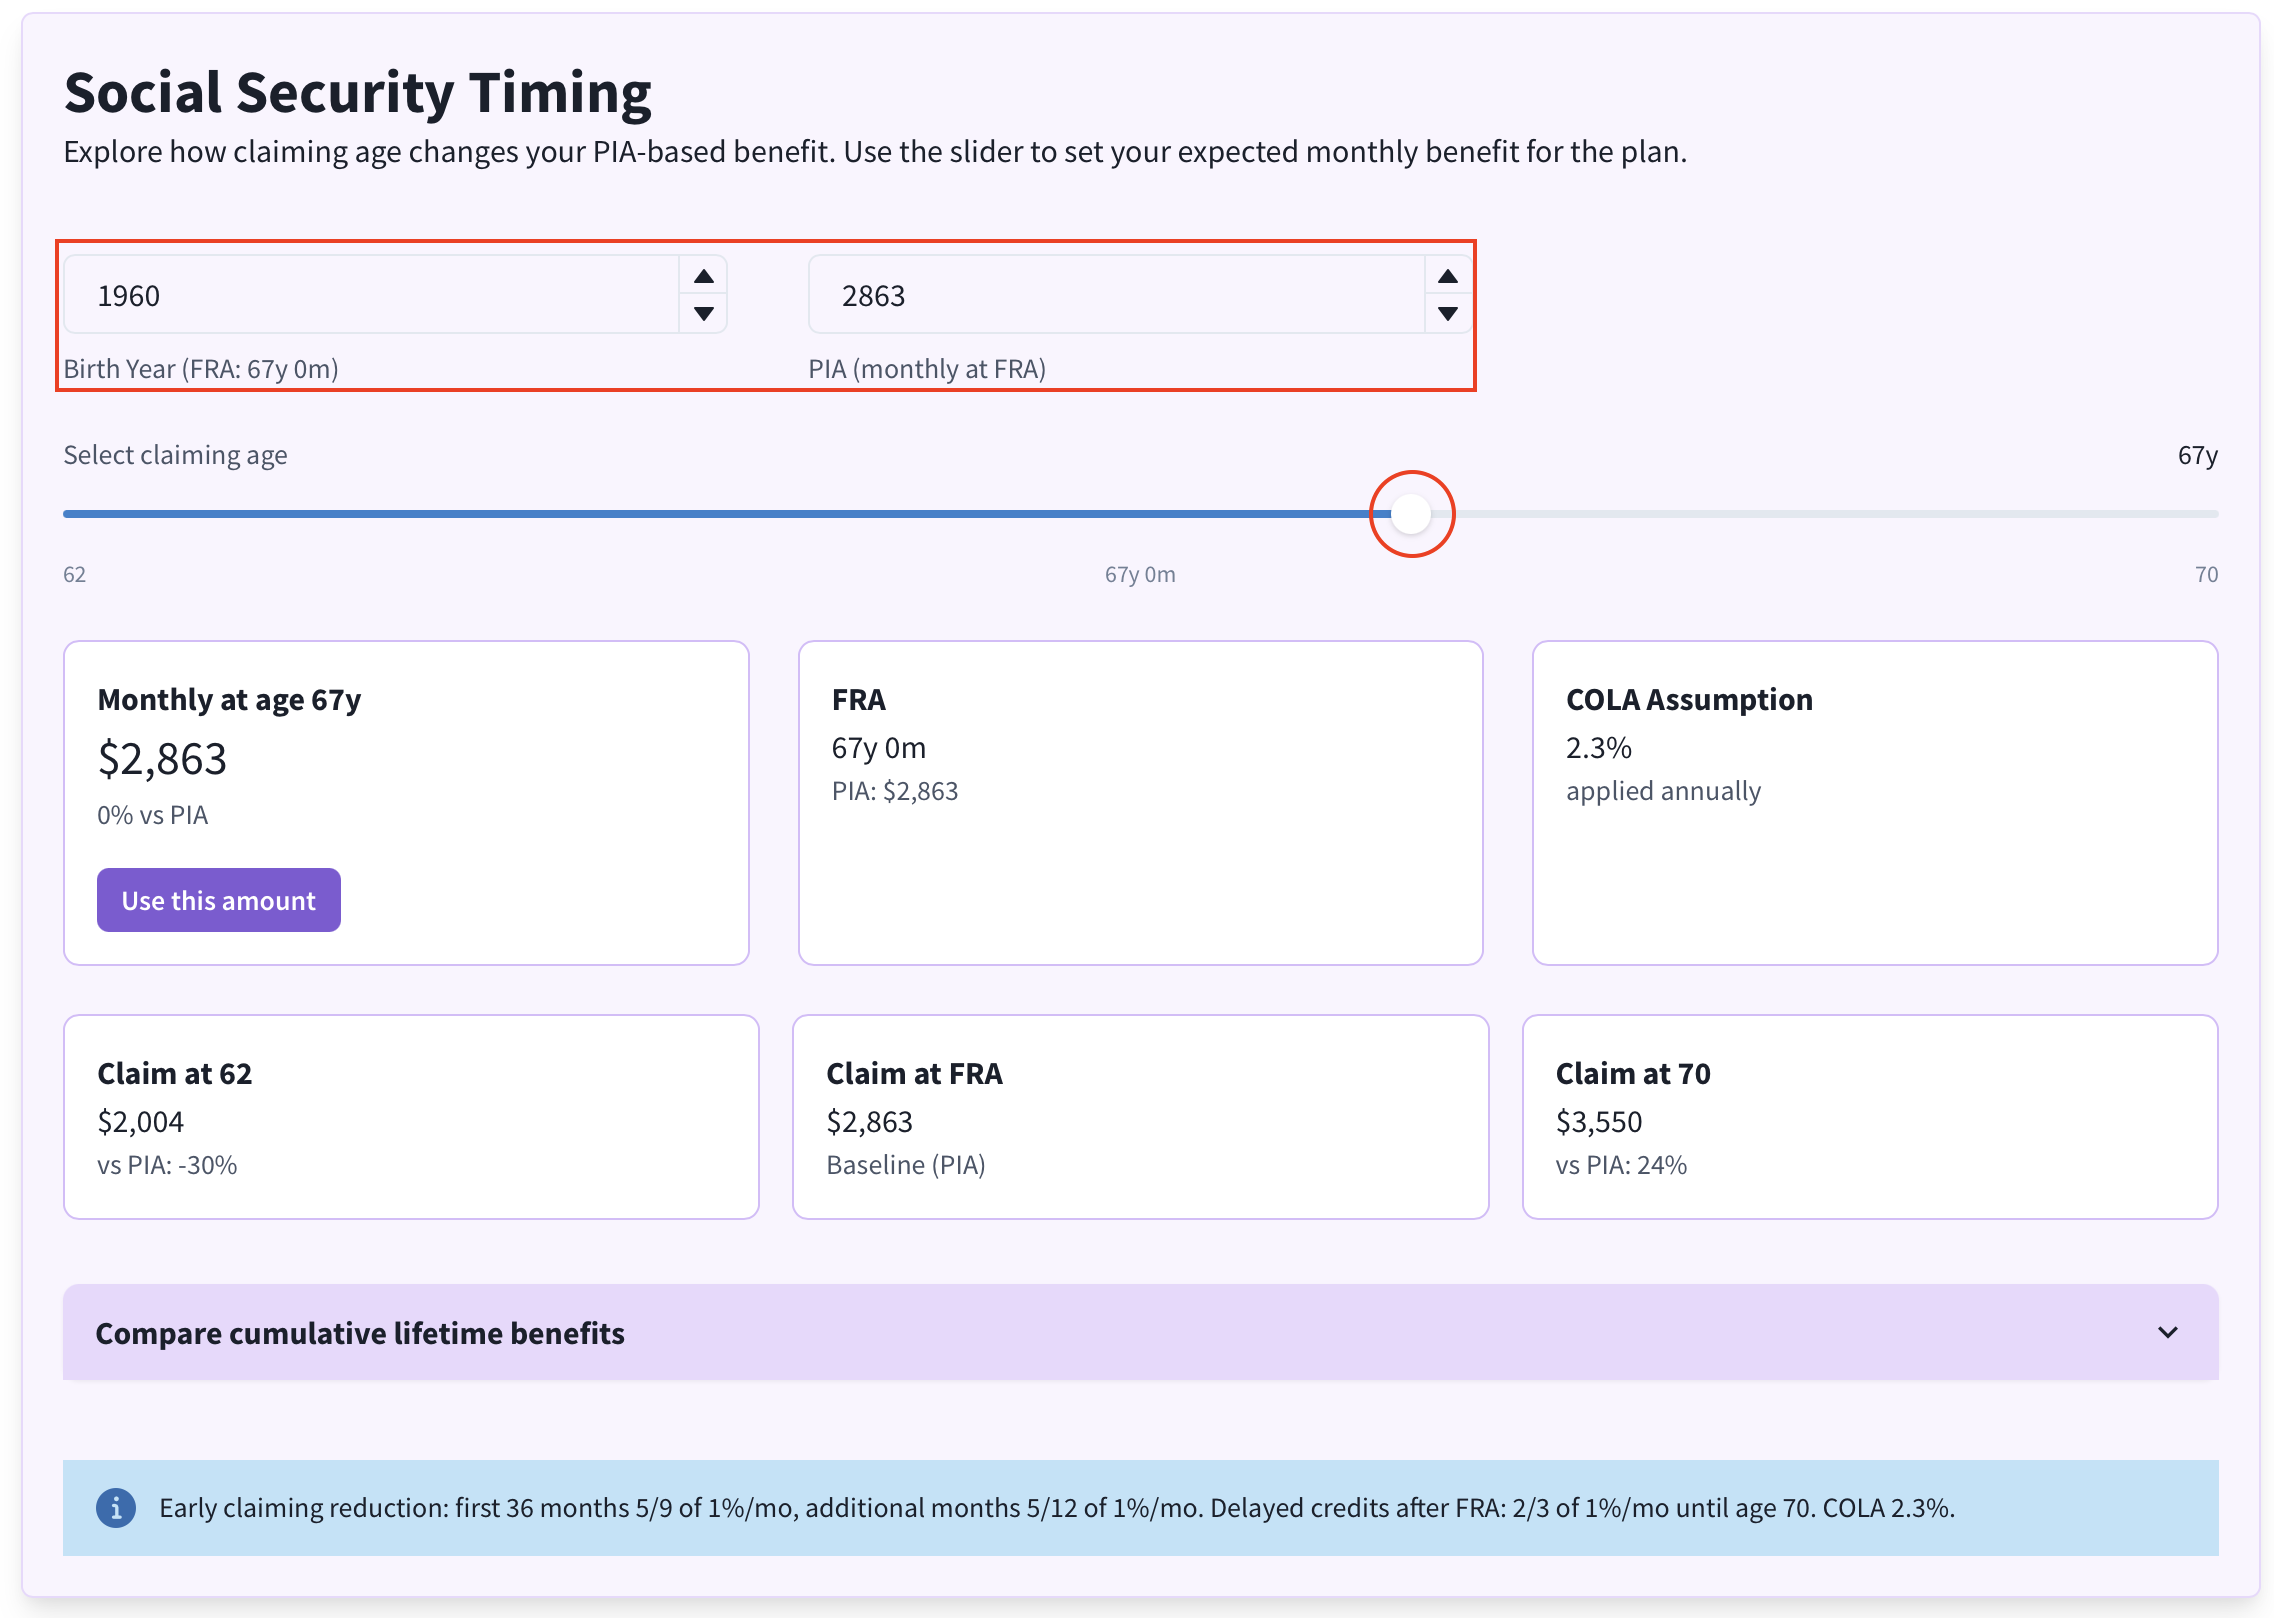
Step 6: Explore Social Security Timing
Use the new "Social Security Timing" section to experiment with different claiming ages. Add your birth year, adjust your Primary Insurance Amount (PIA), move the slider to pick a claiming date, and compare how monthly benefits shift between ages 62, Full Retirement Age (FRA), and 70.
We need to know the year you were born because Full Retirement Age (FRA) for Social Security, set at 65 for those born before 1938, rose under 1983 reforms to 66 for 1943–1954 births, then to 67 for those born in 1960 or later, stabilizing in 2023. No further changes have occurred by 2025; claiming at 62 cuts benefits up to 30%, while delaying to 70 increases them by 8% yearly.
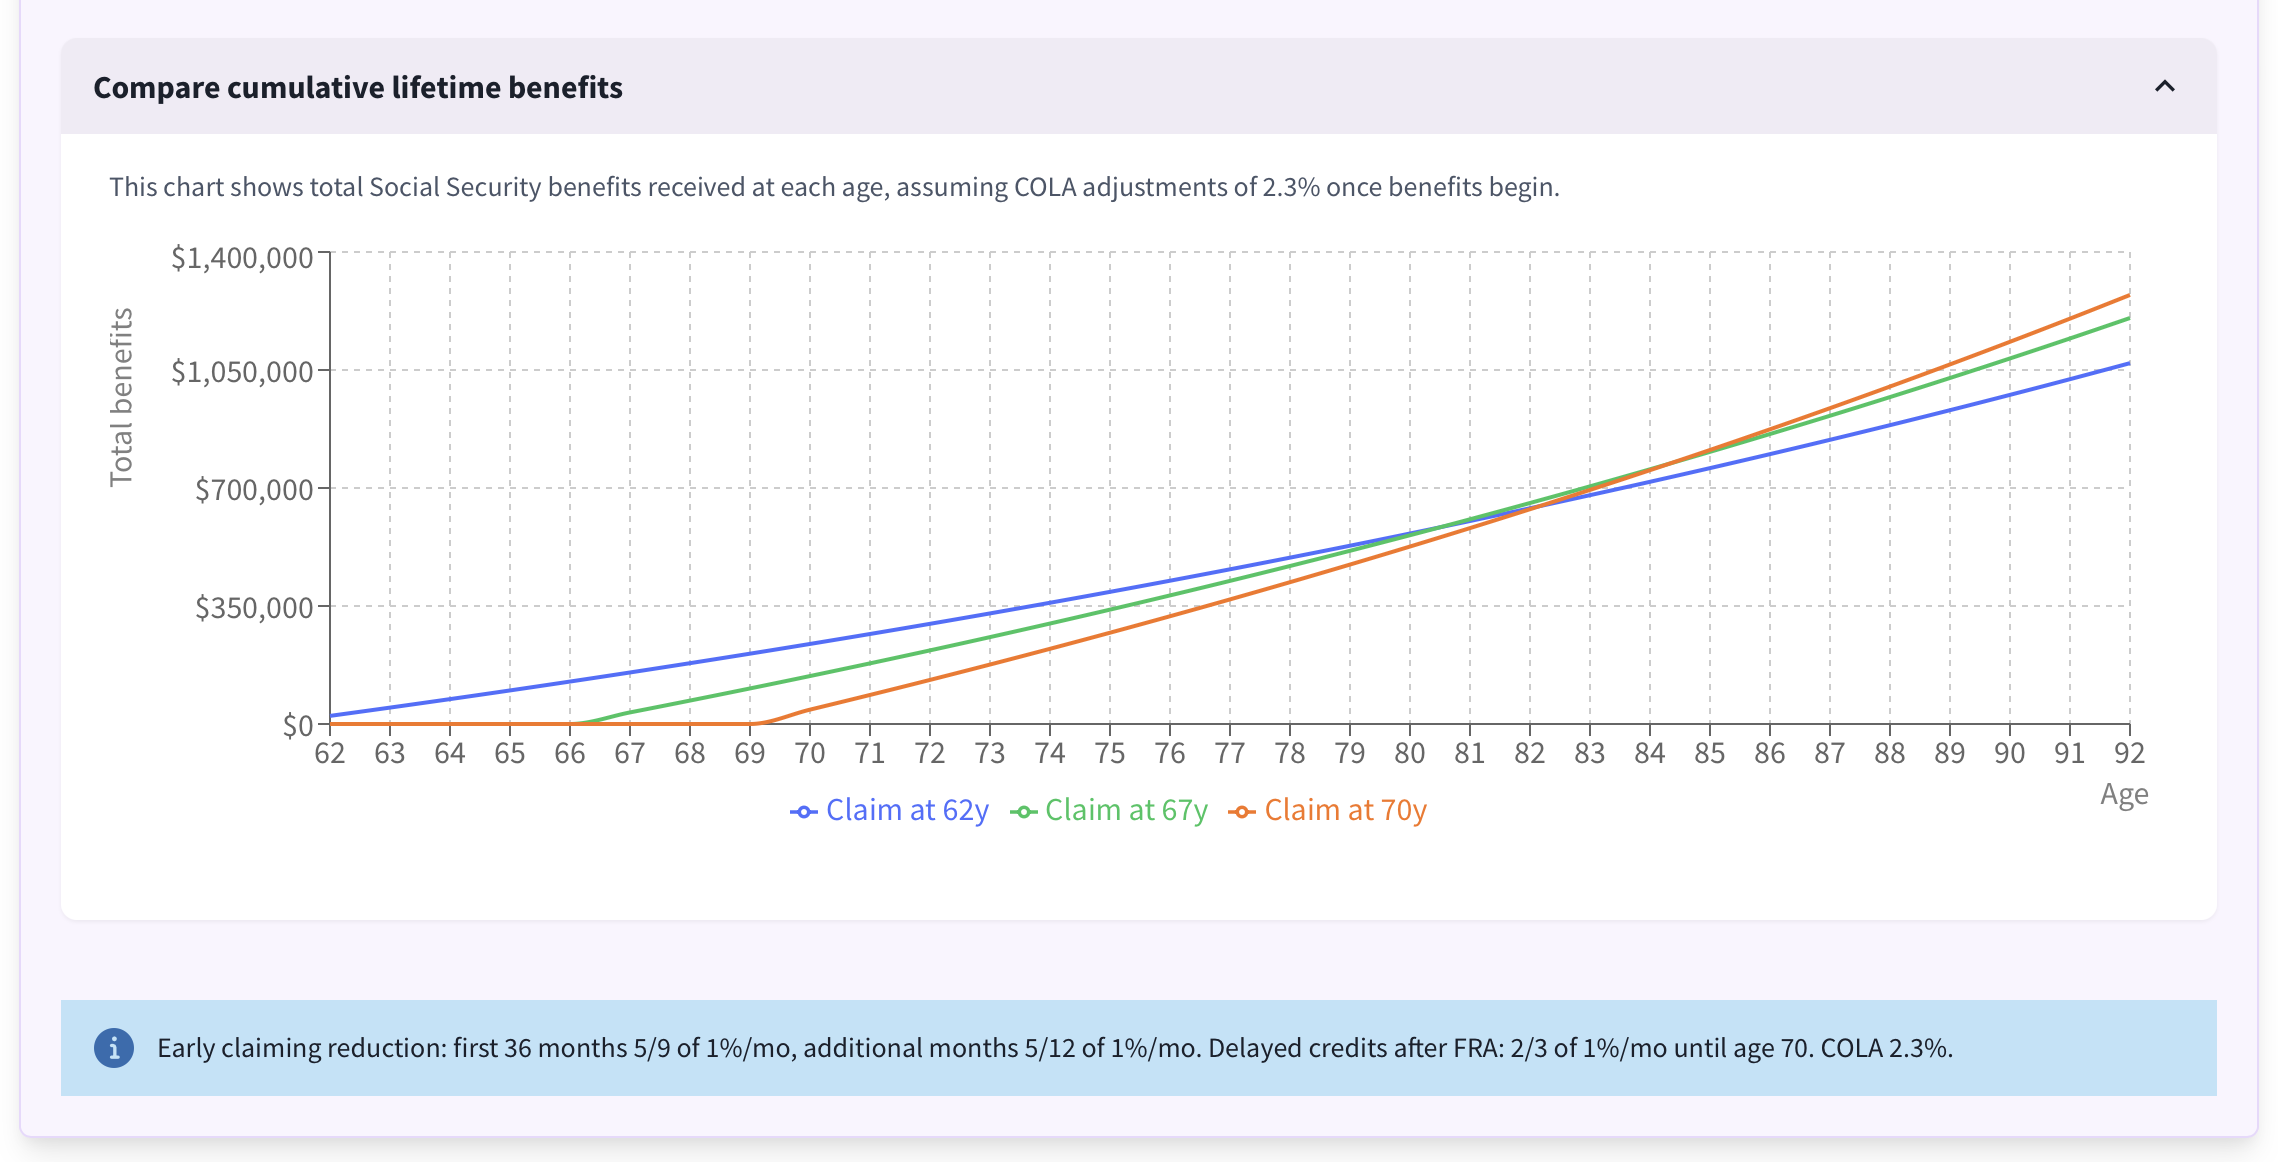
Open the chart to view a cumulative benefits chart. This visualization shows the total Social Security dollars received over time for each claiming age option, including the custom age you choose.
Claiming Age Slider:
Displayed in years and months so you can precisely match your planned start date.Use This Amount Button:
Instantly applies the selected monthly Social Security benefit to the main calculator inputs.Cumulative Benefit Chart:
Compares how total lifetime benefits stack up when claiming early versus waiting.
Social Security Benefits
Social Security benefits are a critical component of retirement income. Only you get to decide when to start receiving benefits.
The table below provides a comprehensive overview of U.S. Social Security retirement benefits, focusing on key claiming ages. Benefits are based on your Primary Insurance Amount (PIA)—the monthly amount at Full Retirement Age (FRA)—calculated from your 35 highest-earning years (adjusted for inflation). Claiming before FRA reduces benefits permanently; delaying past FRA increases them via delayed retirement credits (up to age 70).
| Claiming Age | Reduction/Credit from PIA | Typical Monthly Benefit | Maximum Monthly Benefit |
|---|---|---|---|
| 62 | -30% (up to, depending on FRA) | $1,346 | $2,831 |
| 66 | -20% to 0% (varies by birth year) | $1,811 | $3,795 |
| 67 | 0% | $1,922 | $4,018 |
| 70 | +24% to +32% (8% per year past FRA) | $2,733 | $5,108 |
Descriptions
Age 62: Earliest eligibility; benefits reduced for early claiming. Suitable if you need income soon or have health concerns.
Age 66: Near-FRA for those born 1943–1954; partial reduction if FRA > 66.
Age 67: FRA for those born 1960+; full unreduced benefit.
Age 70: Latest claiming age; maximizes lifetime payout for most (no further credits after 70).
FRA: Varies by birth year (e.g., 66 years 10 months for those born in 1959; 67 for 1960+). Use your birth year to determine exact FRA.
Typical Amounts: Average monthly benefits for retired workers claiming at each age, based on SSA data as of mid-2025 (after 2.5% COLA). These reflect a mix of earners and claiming strategies.
Maximum Amounts: For high earners (at or above the 2025 wage cap of $176,100 for 35+ years), assuming optimal claiming.
Reduction/Credit: Percentage adjustment from PIA. Early: ~5/9% per month before FRA. Delayed: 2/3% per month after FRA (8% annually) until age 70.
Data Sources
Rate of Inflation and Cost-of-Living Adjustments (COLA)
The average rate of inflation in the US is typically measured using the Consumer Price Index for All Urban Consumers (CPI-U) and calculated as the arithmetic mean of the year-over-year percentage changes (December to December) over the specified period. Data is sourced from the US Bureau of Labor Statistics (BLS) via reliable aggregators. (See below.)
| Period (Years) | Ending Year | Average Annual Inflation Rate (%) | Average Annual SS COLA (%) |
|---|---|---|---|
| 1 | 2025 | 2.4 | 2.5 |
| 2 | 2025 | 3.0 | 2.9 |
| 5 | 2025 | 3.2 | 4.5 |
| 10 | 2025 | 2.6 | 2.9 |
| 20 | 2025 | 2.3 | 2.2 |
| 30 | 2025 | 2.3 | 2.3 |
| 40 | 2025 | 2.8 | 2.9 |
| 50 | 2025 | 3.6 | 3.8 |
Inflation varies from year to year, and multi‑year averages can differ significantly. Below are the highest and lowest rolling average inflation rates for common periods between 1975 and 2024.
| Period Length | Highest Average Inflation | Lowest Average Inflation |
|---|---|---|
| 1 Year | 13.5% (1980) | -0.4% (2009) |
| 5 Years | 9.8% (1977–1981) | 1.3% (2012–2016) |
| 10 Years | 7.8% (1975–1984) | 1.6% (2009–2018) |
| 20 Years | 5.7% (1975–1994) | 2.1% (2001–2020) |
Historical Investment Returns
The table below summarizes rolling average returns through 2023 for common horizons. Here, "CONSERVATIVE (20/80) (%)" refers to a portfolio of 20% stocks and 80% bonds, "MODERATE (50/50) (%)" refers to a portfolio of 50% stocks and 50% bonds, and "AGGRESSIVE (80/20) (%)" refers to a portfolio of 80% stocks and 20% bonds.
| Period (Years) | Ending Year | S&P 500 (%) | Bonds (%) | Conservative (20/80) (%) | Moderate (50/50) (%) | Aggressive (80/20) (%) |
|---|---|---|---|---|---|---|
| 1 | 2023 | 24.23 | 5.53 | 9.20 | 14.88 | 20.56 |
| 2 | 2023 | 8.40 | 0.35 | 1.75 | 4.38 | 6.99 |
| 5 | 2023 | 15.69 | -3.12 | 2.87 | 6.29 | 9.70 |
| 10 | 2023 | 12.03 | 1.50 | 3.81 | 6.77 | 9.72 |
| 20 | 2023 | 9.60 | 3.72 | 5.10 | 6.66 | 8.22 |
| 30 | 2023 | 10.19 | 4.85 | 6.57 | 7.52 | 8.47 |
| 40 | 2023 | 10.94 | 6.20 | 7.31 | 8.57 | 9.83 |
| 50 | 2023 | 11.42 | 6.05 | 7.66 | 8.74 | 9.82 |
Sources